Introduction
Teams can automate pipelines, containerize everything, and ship ten times a day, and still struggle to answer a simple executive question: What did this change in our numbers? If the answer isn’t visible on the KPI dashboard (revenue growth, churn, SLA penalties, $/transaction), the program reads as cost rather than leverage. Agile devops is supposed to change that. Not by “going faster” in isolation, but by creating a clear, defensible link between engineering work and business outcomes.
This guide gives you that link: a mapping from practice → DORA metric → business KPI, plus the governance and instrumentation that make progress obvious. We’ll stay technical and specific, with a few short examples you can pressure-test in your own org.
Why aligning KPIs with agile devops is non-negotiable
When engineering metrics (MTTR, deployment frequency) live far from boardroom metrics (ARR, churn, support costs), good work gets mislabeled as overhead. In a healthy agile devops setup, delivery is anchored to three value pillars:
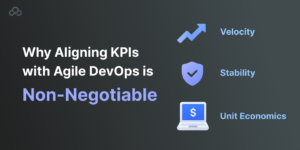
- Velocity , Can we deliver meaningful features quickly and safely?
- Stability , How often does production break, and how quickly do we recover?
- Unit economics , What does it cost to serve one request or one customer as we scale?
Those pillars answer the questions leaders actually ask: Will the holiday release hold? Is our recovery trajectory improving? Are we scaling users without scaling cost at the same rate?
KPIs ↔ DORA: the common language
DORA metrics give engineering a vocabulary that finance and product recognize. Use them as the “bridge” (or better, the link you can defend).
Table 1 , Business KPI to DORA mapping (with the exec readout)
|
Business KPI |
DORA Metric |
Why it matters |
Executive read |
|
Time-to-market |
Lead time for changes |
Faster lead time brings features and fixes to users sooner |
“We cut idea-to-prod from 10 days to 3, so Q3 launch is feasible” |
|
Feature adoption / conversion |
Deployment frequency |
Safe, frequent releases enable more experiments |
“We can A/B three onboarding variants per week” |
|
SLA penalties / uptime |
Change failure rate |
Lower failure rate reduces incident volume and exposure |
“Penalties down; fewer nasty Thursday night rollbacks” |
|
CSAT / churn |
Mean time to recovery (MTTR) |
Quicker recovery limits disruption and complaints |
“Average outage impact is down to minutes, not hours” |
|
Cloud $/txn |
(Cross-metric, see IaC/observability) |
Efficiency signals scale discipline |
“$0.004/txn despite 2× traffic” |
Quick example: A fintech dropped change failure rate from ~24% to ~9% and saw refund-related costs fall in the next quarter. Causality is never perfect, but the correlation was strong enough to change budget conversations.
Practice → Metric → KPI: a practical playbook
Instead of repeating a rigid “practice/metric/impact” template, let’s vary the angle and get closer to how the work really shows up in numbers.
CI/CD (start with the pain)
Big releases fail loudly. Smaller, frequent releases fail softly, and are reversible. Trunk-based development, automated builds, gated quality checks, and progressive delivery shrink lead time and raise deployment frequency. Business effect: faster experimentation on revenue features and less reputational damage when (not if) a defect slips through.
Infrastructure as Code (start with the KPI)
Refunds and SLA credits often spike after configuration mishaps. IaC reduces misconfigurations by version-controlling environments and shipping infra through the same pipeline discipline as app code. You’ll typically see change failure rate come down and provisioning time for new lines of business fall from weeks to hours. The CFO hears: predictability and fewer “we broke prod with a clicky-change” incidents.
Automated testing (start with the metric move)
When defect escape rate drops, so do support calls and escalations. Layer unit, integration, and end-to-end tests; gate risky paths; add contract tests for external APIs. This improves change failure rate without inflating cycle time when done judiciously. (Over-testing the wrong surfaces does the opposite, keep it risk-based.)
Observability & feedback loops (start with alignment)
Dashboards are only useful if they explain customer impact in one glance. Tie traces, logs, and metrics to SLIs/SLOs. When MTTR drops, you should also see fewer SLA minutes lost and better CSAT. Put those on the same screen. If leaders can’t see the link, they’ll assume it isn’t there.
Automated incident response (the moments that matter)
Runbooks-as-code, guardrails, auto-rollbacks, self-healing checks, and ChatOps coordination turn panic into procedure. The metric movement is straightforward: MTTR falls, and the distribution of recovery times tightens (fewer long-tail incidents). The KPI translation: reduced downtime cost and lower churn in the week after an outage. Automated incident response is not a nice-to-have once you promise 24/7.
AI in DevOps (use it where humans drown in noise)
Start with anomaly detection on your “golden signals,” alert deduplication, and test-suite selection. The wins show up as lower MTTR (because you find the right signal faster), better lead time (fewer flaky tests), and sometimes a gentler change failure rate curve. AI in DevOps is not magic; it’s a filter and a prioritizer. Retrain when patterns shift.
Containers & orchestration (efficiency that execs feel)
Standardized runtimes, readiness probes, autoscaling, and health-aware rollouts increase deployment frequency safely and improve resource utilization. That’s not just prettier Grafana, done well, it’s better $/txn at higher load.
Make the numbers visible (and worth reading)
Executives don’t need a thousand metrics; they need the ones that change decisions. Keep an agile devops dashboard to 6–8 signals:
- The four DORA metrics (lead time, deployment frequency, change failure rate, MTTR)
- One revenue proxy (feature activation rate, trial-to-paid)
- One risk proxy (SLA breach minutes)
- One efficiency proxy (cloud $/transaction or per active user)
One slide, three charts, clear annotations. If the story isn’t obvious, the problem isn’t the audience, it’s the instrumentation.
Governance that guides, not slows
- Weekly (engineering): What moved? One risk, one fix, one owner. Keep it under 20 minutes.
- Monthly (cross-functional): Put DORA next to revenue/churn/support volume, same deck, same page. Draw the line explicitly.
- Quarterly (leadership): Reset SLOs and guardrails; retire work that didn’t move a KPI; invest in what did.
Express guardrails as code where possible (policy-as-code for risky changes, error budgets for release pace). Governance becomes a feedback loop, not a veto committee.
When to bring in outside help
There are moments when expertise beats “we’ll figure it out.” Devops consulting and managed services help when:
- You need a multi-team CI/CD rollout under compliance pressure.
- You’ve promised 24/7 uptime but SRE capacity is thin.
- You’re migrating platforms and cannot afford a prolonged cutover.
The right devops services and solutions come with hardened runbooks, pre-tuned monitoring, and proven incident workflows. You’re buying time and reliability, not just hours. (And yes, keep product-specific logic in-house, consultants should accelerate your platform and practices, not own your core.)
Short field notes
- Fintech: After adopting automated incident response, MTTR fell from ~90 to ~28 minutes. Two quarters later, SLA credits were near zero despite higher transaction volume.
- Healthcare SaaS: AI in DevOps (test selection + alert dedupe) lifted deployment frequency 2× without raising change failure rate. Support backlog shrank by ~12% in the following month.
- Retail e-commerce: IaC templates enabled one-day provisioning of seasonal environments; Black Friday traffic didn’t trigger a scaling scramble, and $/txn stayed flat while orders doubled.
Correlation isn’t always causation; still, when the lines move together over weeks, not hours, you can usually defend the story.
Common pitfalls (and the small fixes that matter)
- Tooling without targets: Define the business KPI each metric is meant to influence before you automate it.
- Over-automation early: Start where incidents and handoffs repeat. (If it hasn’t happened twice, probably don’t automate it yet.)
- Dashboards that shout: Cap to 6–8 signals; annotate big changes; assign owners.
- Culture mismatches: New tools won’t survive old incentives. Tie team goals to the same KPIs you present to leadership.
- AI everywhere (too soon): Begin with alert noise and test flakiness; avoid canary decisions until you’ve built trust in the models.
A 90-day path you can actually run
o–15 Days: Map and baseline
- Pick 3–4 business KPIs that matter this quarter.
- Map each to one DORA metric; baseline last 30–60 days.
- Build the single dashboard (yes, the one slide).
16–45 Days: Prove one link
- Improve one delivery capability tied to a KPI (e.g., CI/CD for lead time).
- Add AI in DevOps for alert dedupe or test selection if noise is high.
- Start a minimal automated incident response runbook for your top outage type.
46–75 Days: Extend and harden
- Roll the proven practice to a second team or service.
- Policy-as-code for high-risk changes; add rollback templates.
- Validate with weekly numbers and one monthly business review.
76–90 Days : Decide what’s next
- Keep what moved a KPI; pause what didn’t.
- If you’re blocked by scale or skills, consider devops consulting and managed services for the platform lift while your team focuses on product outcomes.
Bringing it together
If a practice doesn’t move a KPI, it’s busywork in better clothes. Use DORA to translate engineering progress into business language; use agile devops practices to move those lines deliberately; and use instrumentation that leadership reads without a tour guide. AI in DevOps and automated incident response aren’t buzzwords here, they’re force multipliers when signal-to-noise is low and minutes matter. And when the clock is running and the stakes are high, the right devops services and solutions will shorten the path from intention to impact.
Technical FAQs
1) How does agile devops lower MTTR without inflating costs?
By removing slow, manual steps. Runbooks-as-code, automated rollbacks, and crisp on-call handoffs shrink recovery time. You spend less time “figuring it out live” and more time restoring service quickly. The result: lower MTTR and fewer SLA minutes lost, without hiring a small army.
2) Where should AI in DevOps start?
Start where humans drown in noise: alert deduplication and anomaly detection on golden signals (latency, errors, saturation). Once trust builds, add predictive test selection to cut cycle time. Steer clear of automated canary decisions until you’ve validated the models against real incidents.
3) How do we prove KPI impact to executives in one slide?
Pick a high-visibility KPI, say, trial-to-paid conversion. Plot it next to deployment frequency and the date your CI/CD upgrade shipped. Annotate the timeline with the two most relevant process changes. Keep the narrative to one paragraph.
4) When do devops consulting and managed services make sense?
During platform migrations, compliance-heavy rollouts, or when you’ve promised 24/7 uptime and can’t reliably meet it yet. You’re buying hardened practices and time to value. Keep domain-specific flows in-house; let partners accelerate platform foundations and incident mechanics.
5) Isn’t “more releases” risky in regulated environments?
It can be, if controls are manual. The fix is automation plus policy-as-code: pre-approved change windows, traceable gates, evidence capture, and documented rollbacks. You get agile devops speed without sacrificing auditability.
6) How many metrics should live on the primary dashboard?
Six to eight. The DORA quartet plus two to four business KPIs (SLA minutes, feature activation, $/txn). If it doesn’t drive a decision, it belongs in a drill-down, not the front page.
Do you like to read more educational content? Read our blogs at Cloudastra Technologies or contact us for business enquiry at Cloudastra Contact Us.